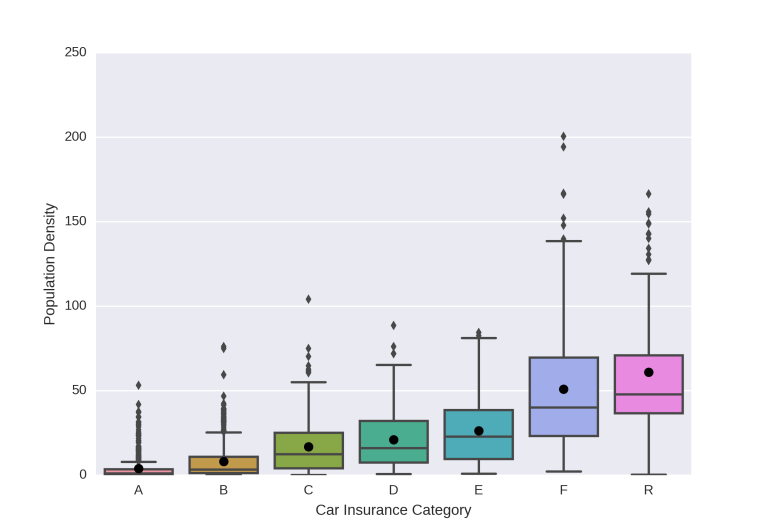
Relationship between Car Insurance Price and Population Density
There was some discussion in my office today about the correlation between car insurance prices and where you live. The idea being that the prices may be correlated with population density.
Exactly how car insurers create their prices is not clear. But there is plenty of discussion online that it is, at least in part, related to your postcode. Many explain this relationship between price and postcode as being down to the crime rate in the area. However one of the PhD students in my office (Steve) said that it was to do with population density in the individual postcodes (the basic idea being more people = more accidents). Indeed, it has already been shown that crime rate is correlated to population density. So showing a relationship between car insurance categories and population density, also shows a correlation between the categories and crime rate (as the online discussion suggests). So this all seemed like an interesting thought and so I went online and grabbed some data.
The car insurance prices are split into 7 categories (‘A’ – ‘F’ and ‘Refer’) from here (with original data from motorcarinsuranceuk.co.uk which is no longer availablle). The site mentioned that the data is as “accurate as far as we know but there could be slight differences”. ‘A’ is a ‘good postcode / low risk’ and ‘Refer’ means that an individual would need to contact the individual car insurers (I take this to mean that ‘Refer’ is worse than an ‘F’). This conveniently gives a breakdown of category by postcode.
The population density of each postcode can be found from the Office for National Statistics. Specifically from table QS102EW.
Creating a box plot (including the mean) of the data (insurance category against population density) shows that there is a correlation between population density and car insurance category as Steve expected.

The lower the population density the better category car insurance you can get.
The plot was created using the Seaborn: statistical data visualization package.
Enjoy Reading This Article?
Here are some more articles you might like to read next: