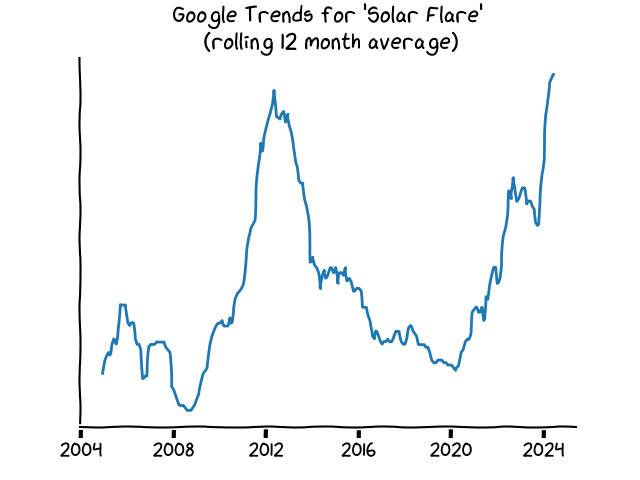
Google Trends for Solar Flares
Google Trends shows the popularity of search queries in Google Search across various regions and languages. Below I have plotted the data for “Solar Flare”. Google Trends report this as “interest over time”, whcih is defined as:
Numbers represent search interest relative to the highest point on the chart for the given region and time. A value of 100 is the peak popularity for the term. A value of 50 means that the term is half as popular. A score of 0 means that there was not enough data for this term.
Since this is quite odd, I have decided to removed outliers (by using a 95% Z-transform threshold) and have then plotted the rolling 12-month average:

I think it shows a pretty good solar cycle (although shifted by about 2yrs) in terms of peak sunspot number.
Enjoy Reading This Article?
Here are some more articles you might like to read next: