The World Cup is almost upon us and so it’s time to make some predictions…
My model, like a lot of others, is based on the World Football Elo ratings (WFER). Which is a system that uses the Elo rating system. You can read all about Elo on those two links, but basically after every game a team gains or loses points. The change in points is dependent on the two rankings of the teams. If there is a large difference between the two teams and the lower ranking team wins then they would gain a lot more points than if the higher ranking team won (since it is expected that they should win).
The rating system gives different weightings for the tournaments that games take place in. They rank them in the following order:
- World Cup finals,
- Continental championship finals and major intercontinental tournaments,
- World Cup and continental qualifiers and major tournaments,
- All other tournaments,
- Friendly matches.
The WFER site takes into account all games that results could be found for (so goes all the way back to the first official International football game, between Scotland and England on 30 November 1872, 0-0).
My model uses a combination of ensemble machine learning methods for classification problems, random decision forests. Each decision tree in the ensemble is taken from a bootstrap sample of some training set where observations about an item (represented in the branches) can be used to drawn conclusions about the item’s target value (represented in the leaves). It is a standard technique which has a wide range of uses, including the evaluation of Wikipedia articles quality and importance.
The model uses the WFER data for training, where all friendly matches have been removed (because very often sides don’t play a full strength team in those matches). Different combinations of training data results in different resulting models. Specifically, giving the model the rankings between the two teams and the result of the match (win, draw, loss) gives different results than if you just give the two teams rankings, but only results from major tournaments. For the final results the model has been trained using 76 decision trees with three different datasets:
- All (non-friendly) fixtures,
- All (non-friendly) fixtures since 1980,
- Fixtures from the World Cup, European Championships, Africa Cup of Nations and Copa America.
The final results are then an average of the output of each of the three trained models.
To test the success of the model part of the data (15% in this case) is held back and then compared against. After training the model, the accuracy of the model predictions are compared to the held back data. In this case the model was shown to be 94.8% accurate in predicting a win, draw or loss.
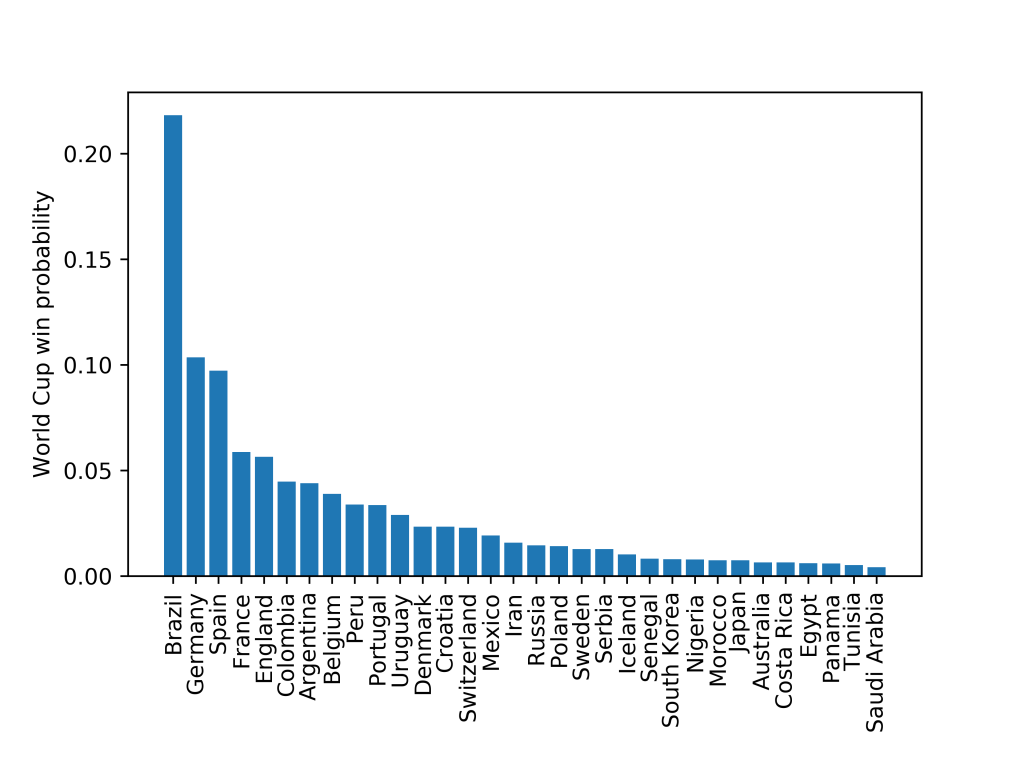
The World Cup can then be simulated running the model for each match. The model returns probabilities of each of the outcomes so the same results don’t happen each time. The simulations are ran 10,000 times in order to get success probabilities for each team:

You can see the model predicts that Brazil have by far the greatest chance of winning the World Cup, over twice as much as the next most likely team, Germany.
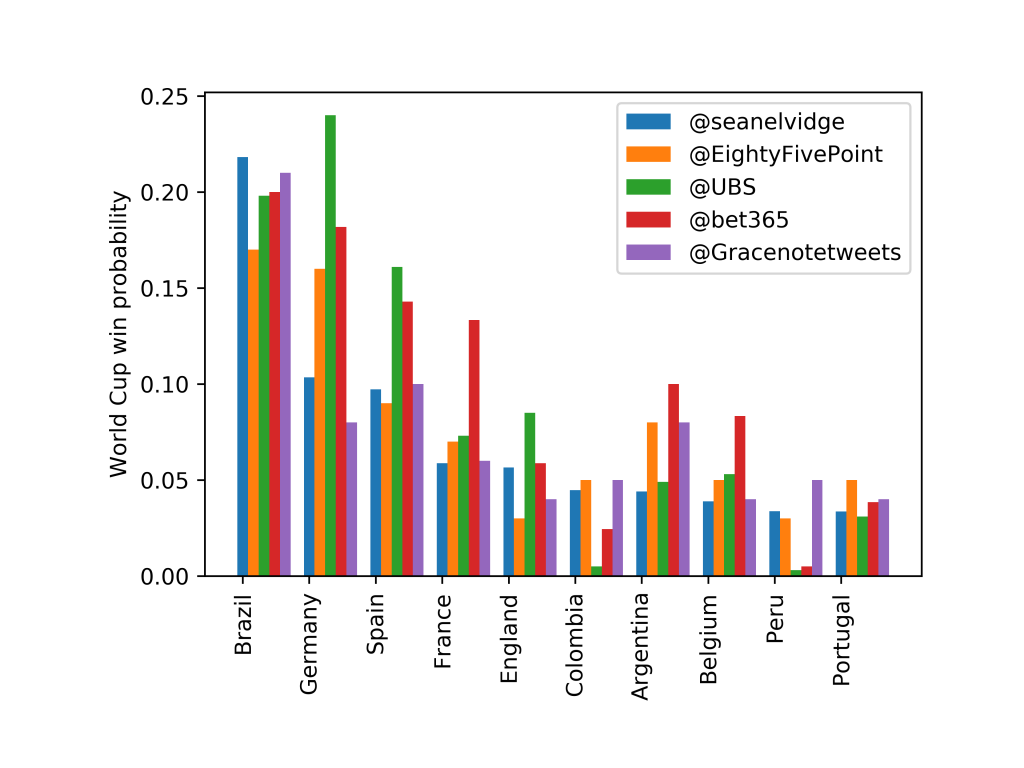
As I mentioned earlier in the post, a lot of people are making predictions of the World Cup results. A selection of those by EightyFivePoints, UBS, Gracenotes and Bet365 are compared below:

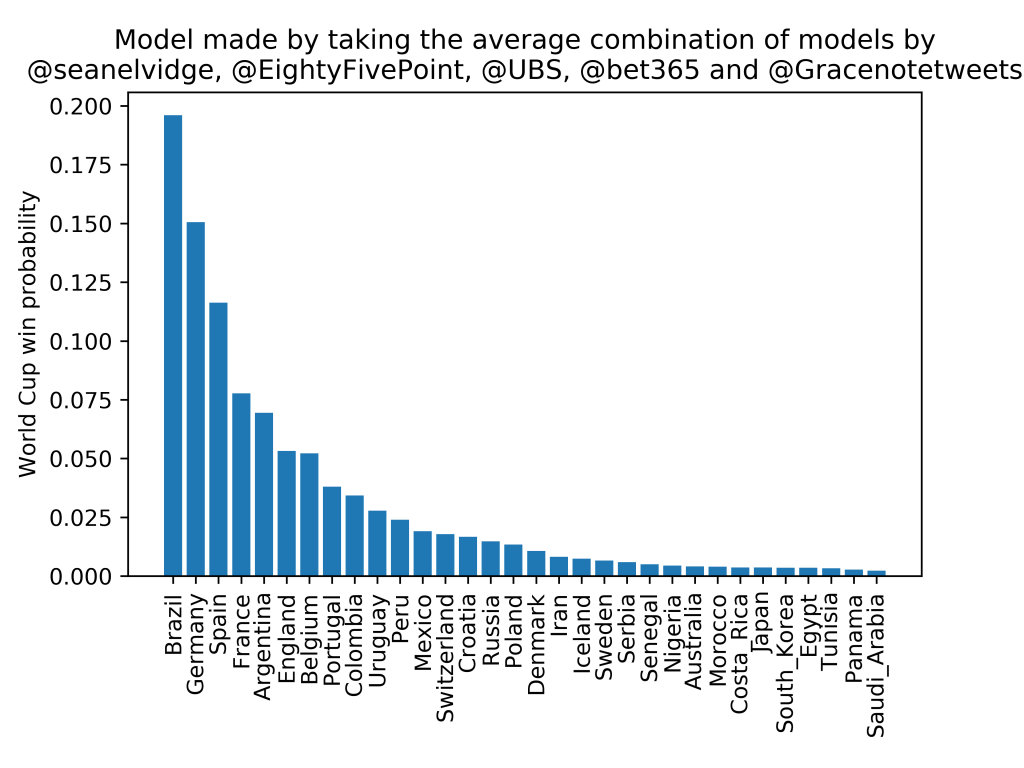
These models (apart from Bet365’s, which is more mysterious and in the above plot is found by taking the odds for each team from the Bet365 website) all use the Elo ranking system in someway (click on the links to find more about each one). Modelling theory would suggest that, without any further details and assuming each of the above models are “good”, the best model would be the combination of them:

Which gives Brazil a 19.6% chance, followed by Germany (15.0%) and Spain (11.6%; although this doesn’t take into account that they sacked their manager 2 days before their first game of the tournament!).