Perhaps we’ve finally worked out Deke Slayton’s method for choosing the Apollo crews, basing it on alphabetical order…
Python’s matplotlib comes with the (incredible) XKCDify. That is a set of routines for making plots look more like Randall’s (xkcd.com). I’ve only recently discovered these routines (matplotlib.pyplot.xkcd()) and so wanted to think of something to use them for (other than just recreating some classic XKCD plots such as xkcd.com/653 and xkcd.com/1220).
The crews of the Apollo missions (and Gemini missions) were chosen by chief Astronaut Deke Slayton. It has always been somewhat of a mystery exactly how he came up with the flight rosters. Well, while walking into work one day I was thinking about this and the thought process popped into my head that I knew Armstrong, Aldrin and Collins were on Apollo 11 (and they are all pretty close to the beginning of the alphabet), and I knew Conrad & Bean were on Apollo 12 (at the time I couldn’t recall, for my sins, the name of the third member of the crew). I knew Lovell and Haise from 13, Shepeard 14 and Young 16. So using what I could recall I thought that this might turn into a decent XKCDify plot. Maybe Deke’s secret all along was a simple one.
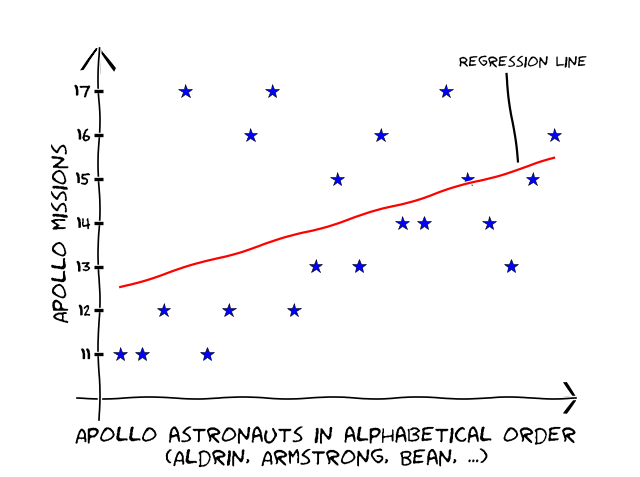
I found the secret! It seems that the order was, at least partially, picked using alphabetical order.
You’re not convinced are you?
This brings me nicely into a topic which is not discussed often enough, confidence intervals. When dealing with correlation plots the most common comment is the “correlation/causation” one. And indeed we can find very strong correlations between many “things”, but this doesn’t mean they are actually related. For example the correlation between the total revenue generated by arcades and computer science doctorates awarded in the US is 0.985 (you can find all manor of amusing examples at tylervigen.com/spurious-correlations). But if we put the causation argument to one side for a moment, we can look at something else, that is the confidence interval of our correlation.
Confidence intervals are an incredibly important tool in any form of statistical analysis. The more data used in calculating some statistical quantity, the more likely we are to “trust” it. Confidence intervals are usually specified at a given percentage level, such as 95% or 99%.
Let’s work through a simple example, for calculating a 95% confidence interval for a percentage. The example is taken from the small print from a TV advert for a popular hair-care product that was on TV tonight. The voice over on the advert says something like “[insert product name] is the nation’s favourite hair conditioner.” At the same time as the statement was being said the small print on the bottom of the screen read:
“73% of 64 people asked agreed.”
So lets work out what that means for our statement. It means that 47 people agreed with this statement (\(0.73\times 64 \approx 47\)). Clearly a larger number of people asked would give us some more faith that this truly is the nations favourite. However we can use the confidence interval to see from a statistical point of view what 73% means when only 64 people are asked.
The formula for working out a 95% confidence interval of a percentage is: \[95\% \mbox{ C.I.} = \pm 1.96 \times \sqrt{\frac{p(1-p)}{n}},\] where \(p\) is the percentage (as a decimal) and \(n\) is the number in the sample. Plugging in our numbers we get:
\begin{eqnarray*}
95\%\mbox{ C.I.} &=& \pm 1.96\times\sqrt{\frac{0.73\times 0.27}{64}},\\
&=& \pm 10.9.
\end{eqnarray*}
This means the 95% confidence interval is \(\approx \pm 11\%\). So therefore we should take the 73% value to be really mean anything in the range 62% – 84%. This is a useful technique to keep in mind when you are dealing with any data. Ask what the confidence intervals are so you can work out how much you trust the result.
We’ve got a correlation coefficient of 0.45 for our alphabetical ordering of Apollo astronauts which indicates a reasonable positive correlation. But what is the confidence interval on that (confidence intervals seem to be even more infrequently used for correlations than they are for anything else!)? Correlation confidence intervals are slightly harder to calculate, and are not symmetric, but you can find all the information about them here (onlinestatbook.com/2/estimation/correlation_ci.html). I can tell you though that, the confidence interval for our astronauts is between 0.023 and 0.738. Which varies from no correlation at all, to a very strong correlation. Maybe we didn’t find Deke’s method after all, or maybe we did! The point is we don’t know for sure and we should always think about confidence intervals!
Here is a link to the code I used to make the plot, in case you want a starting point for messing around with plt.xkcd(). Enjoy!