How does a countries mean transfer spend relate to its UEFA coefficient?
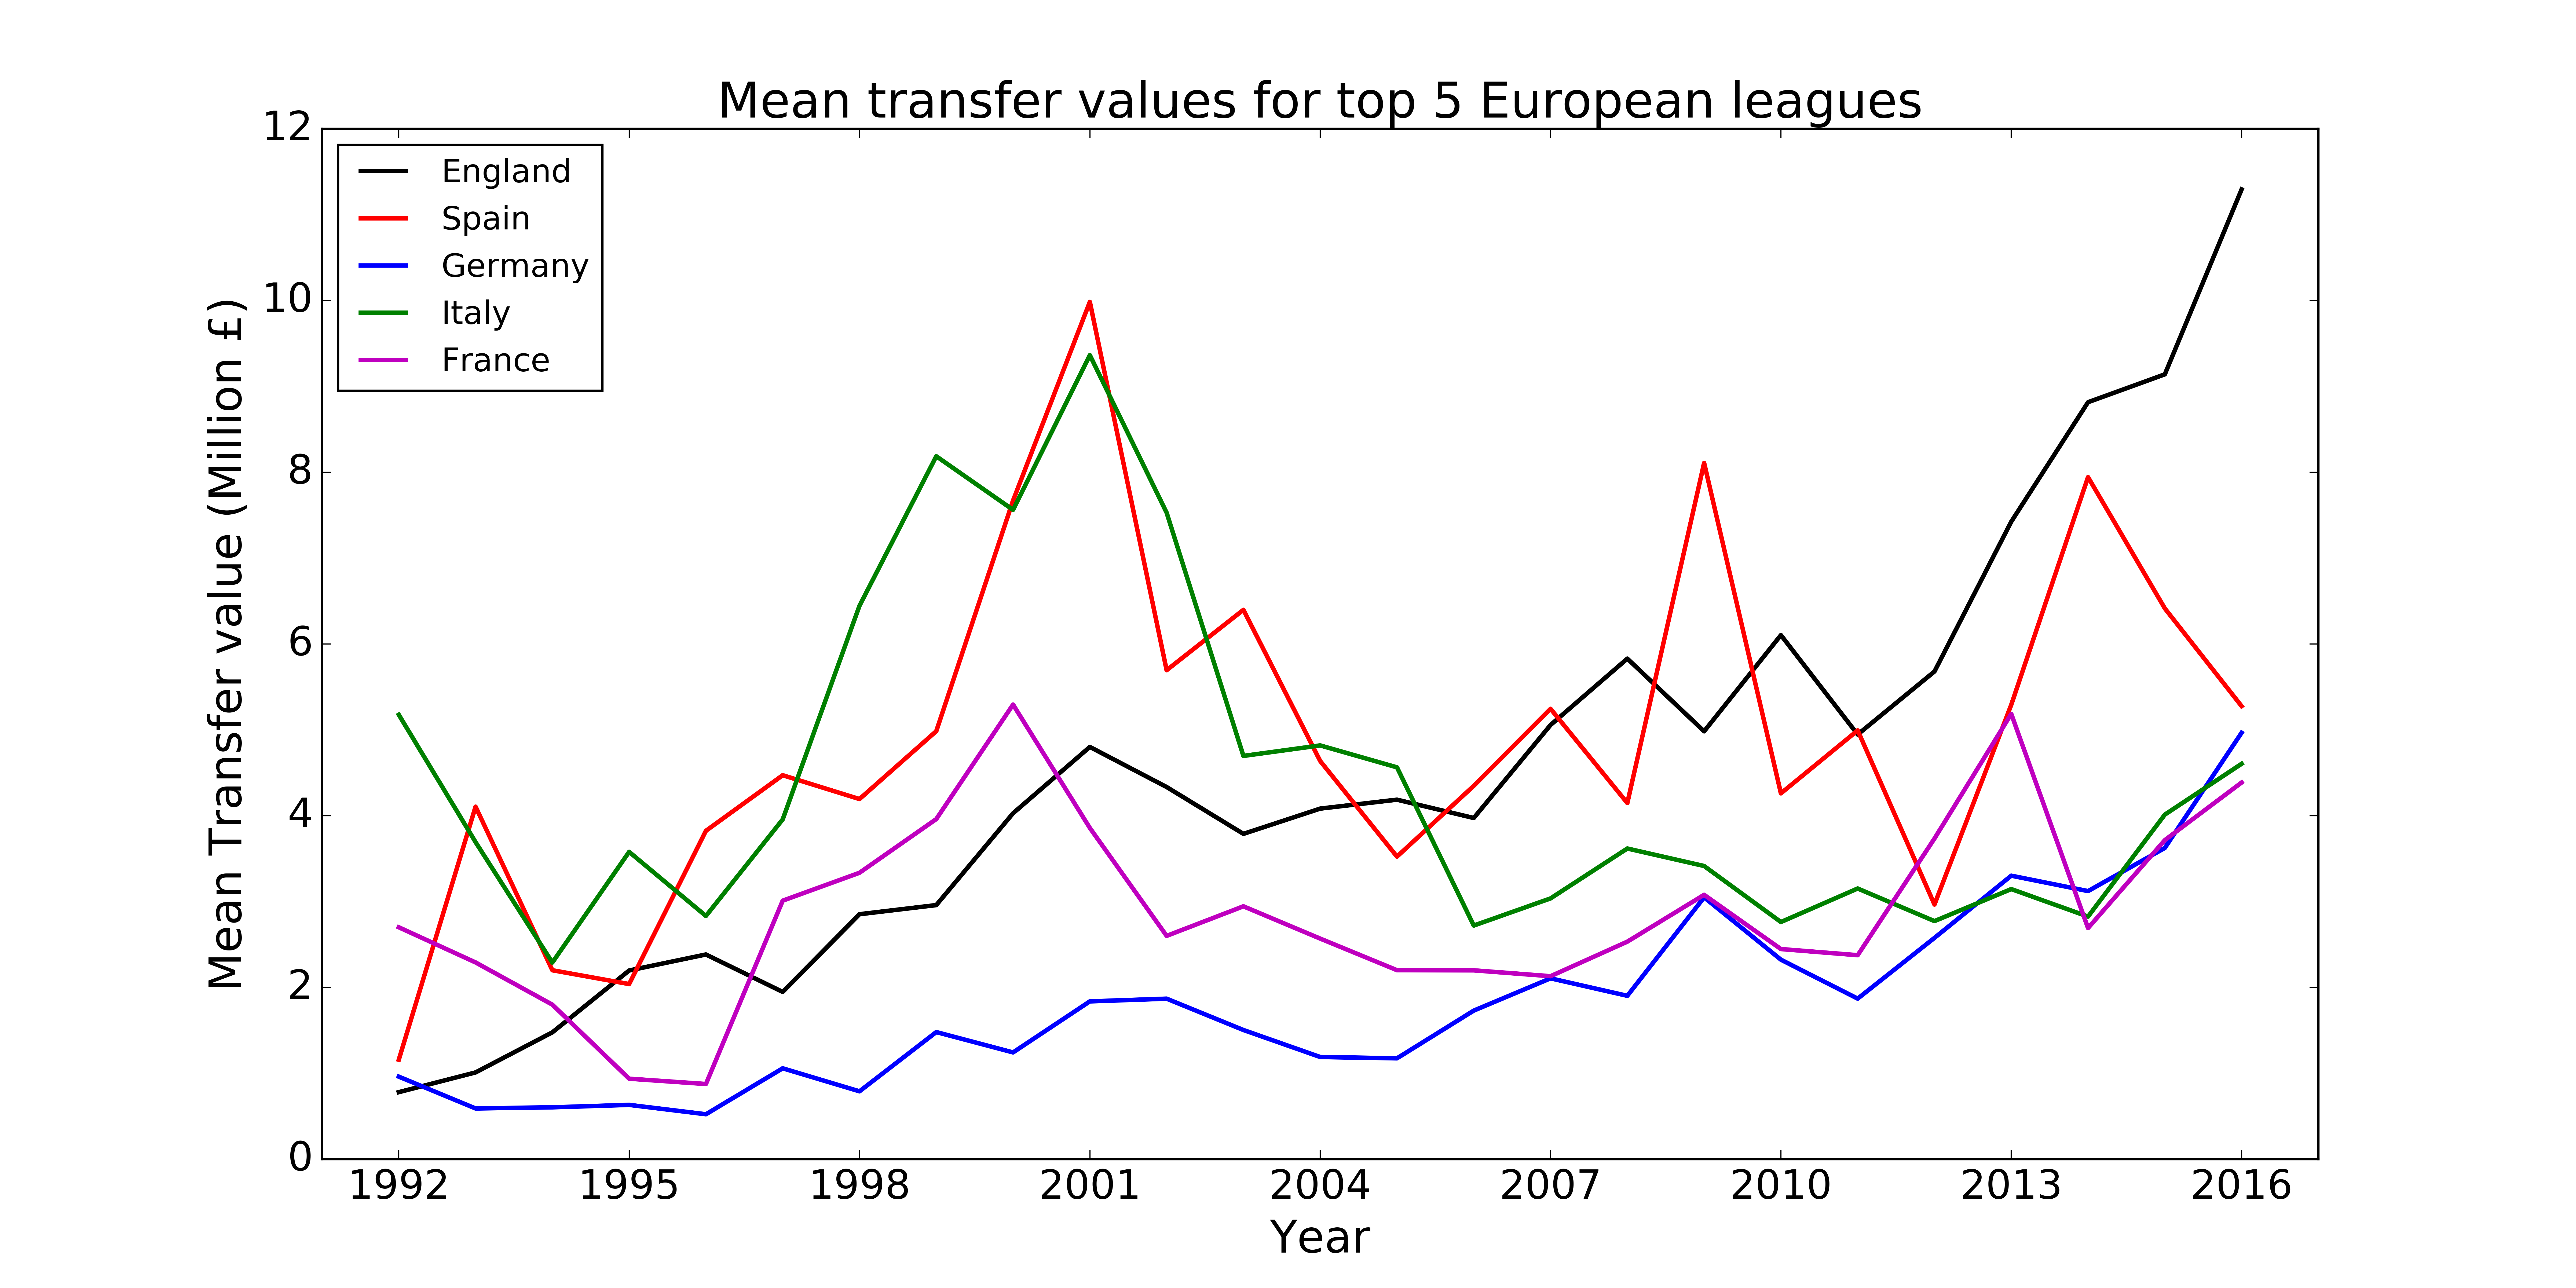
An expansion of the data collected in my previous post lets us compare the mean transfer spend across the big 5 European leagues, the Premier League (England), La Liga (Spain), Serie A (Italy), Bundesliga (Germany) and Ligue 1 (France).
Whilst there has been a steady increase in the mean transfer value in England, leagues like Spain have gone up and down. Does this fluctuation in mean transfer value across a league change the nations overall performance in European competitions? This can be investigated by comparing these mean values with the nations UEFA coefficient. The historic data can be found here.
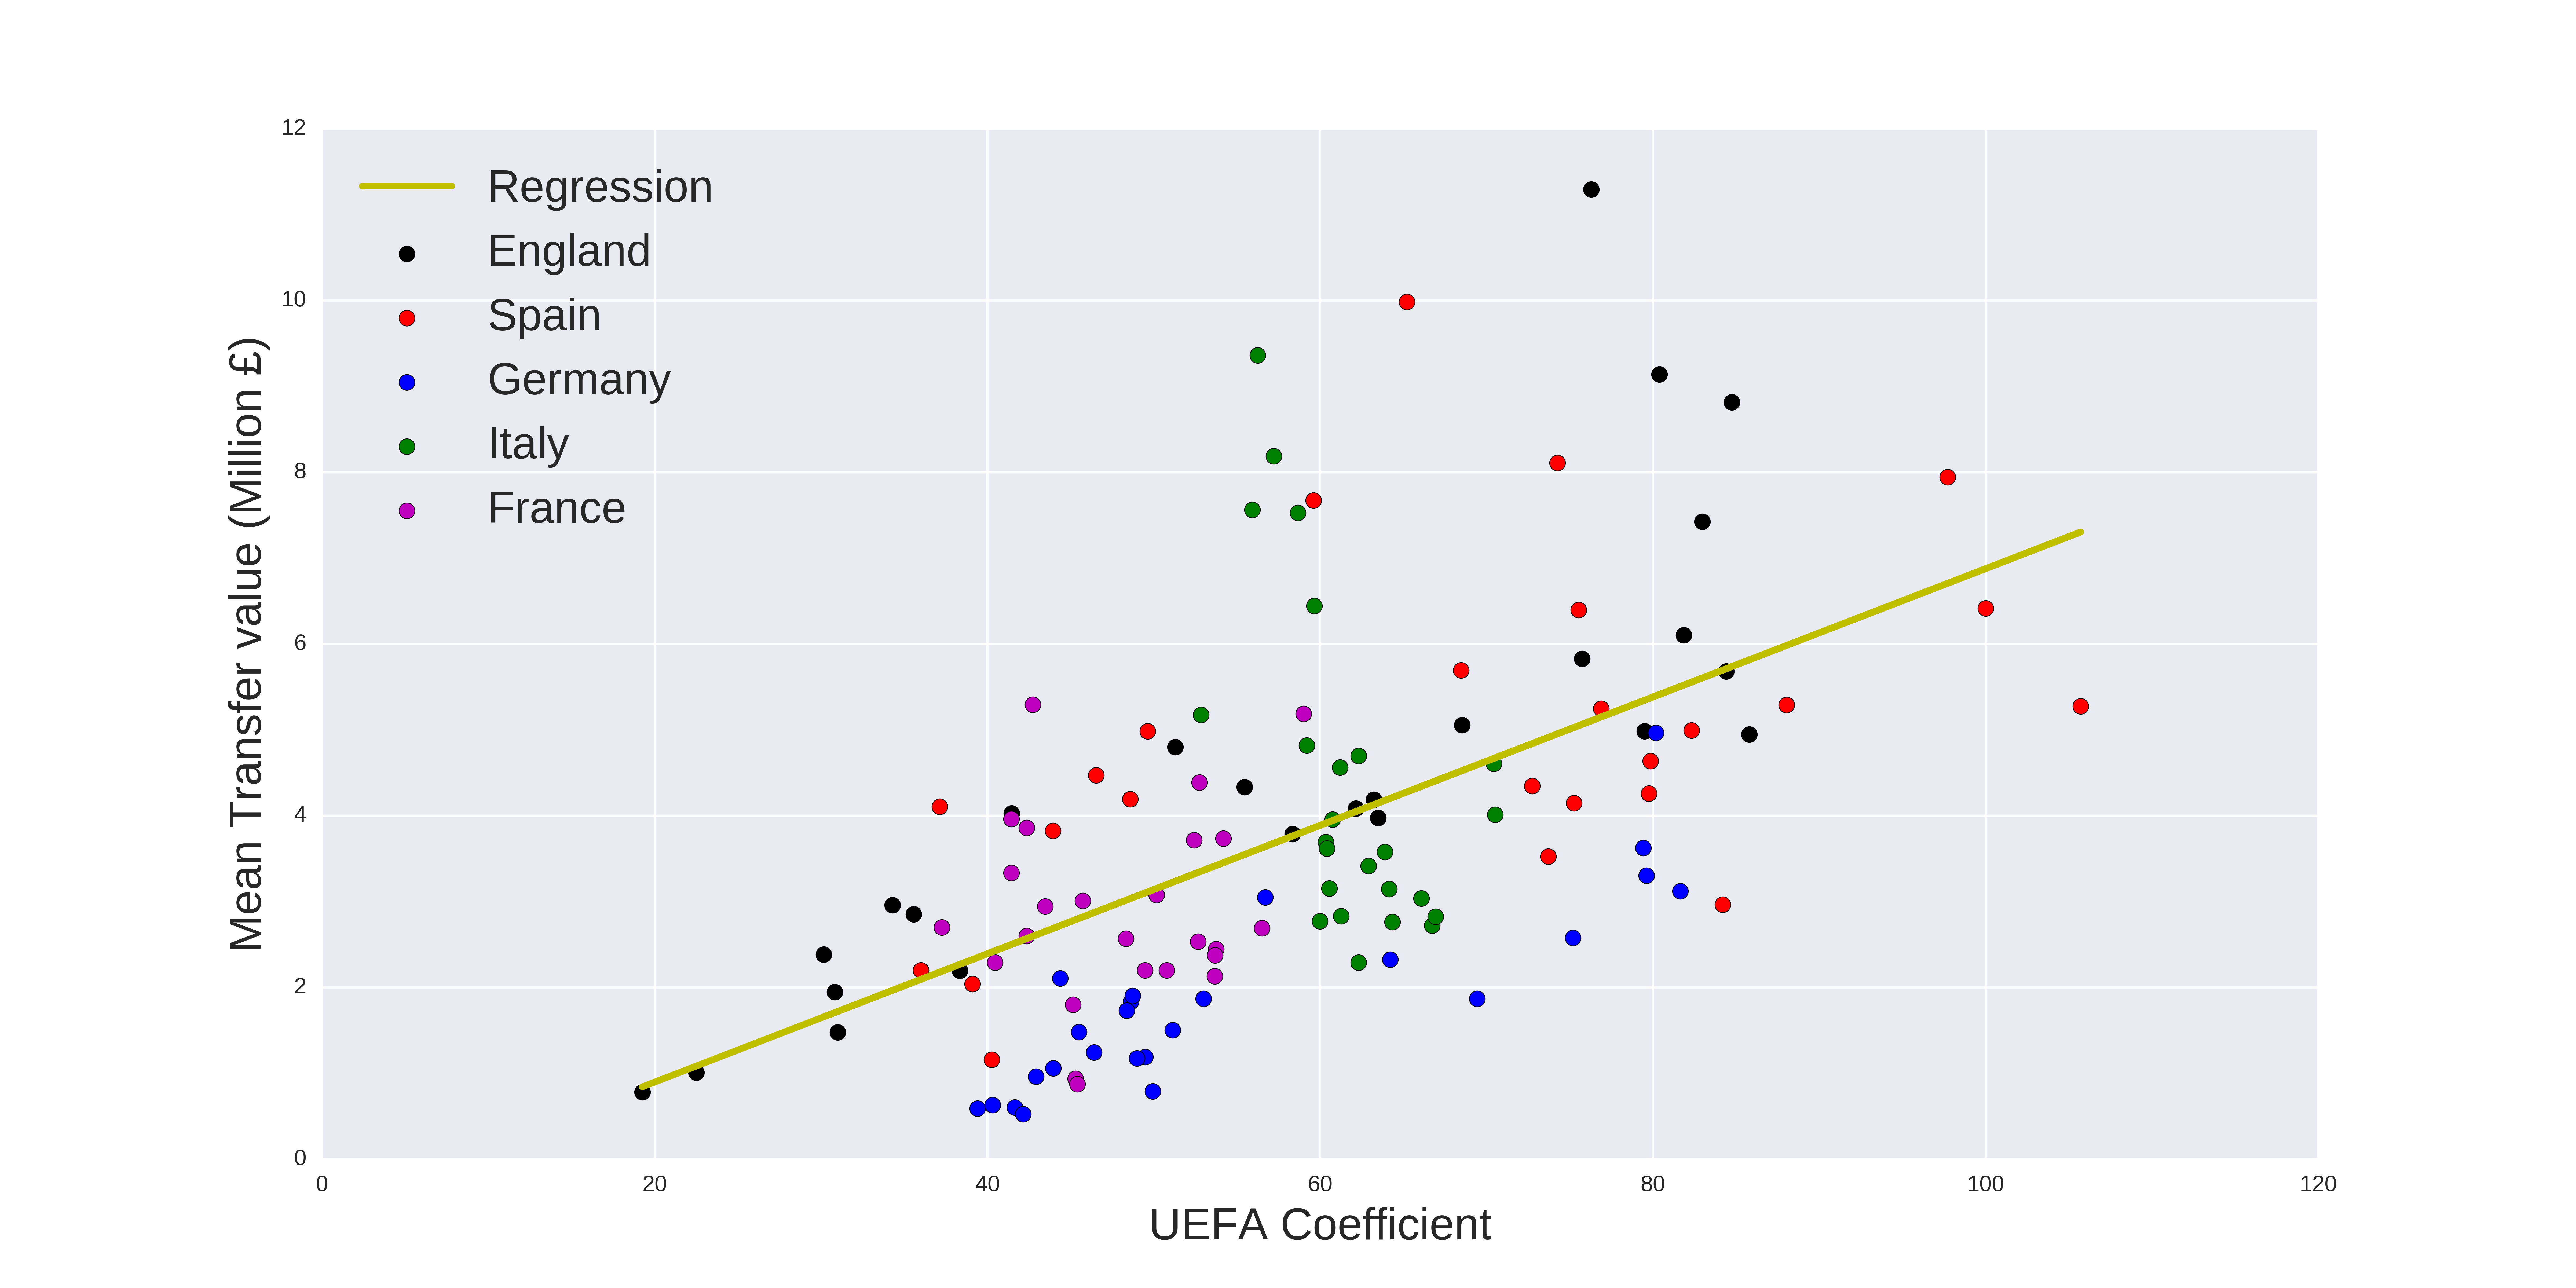
We can then look at the scatter plot between mean transfer values and UEFA coefficients, overplotting a regression line:
The regression fit has a value of 0.57 (with 95% confidence intervals of [0.4746, 0.8274]). Whilst this seems to suggest that a nations mean transfer spend is somewhat related to its UEFA coefficient, there are some clear outliers. In particular it can be seen from the plot above that the Premier League’s big increase in spend hasn’t resulted in any improvement in its coefficient.
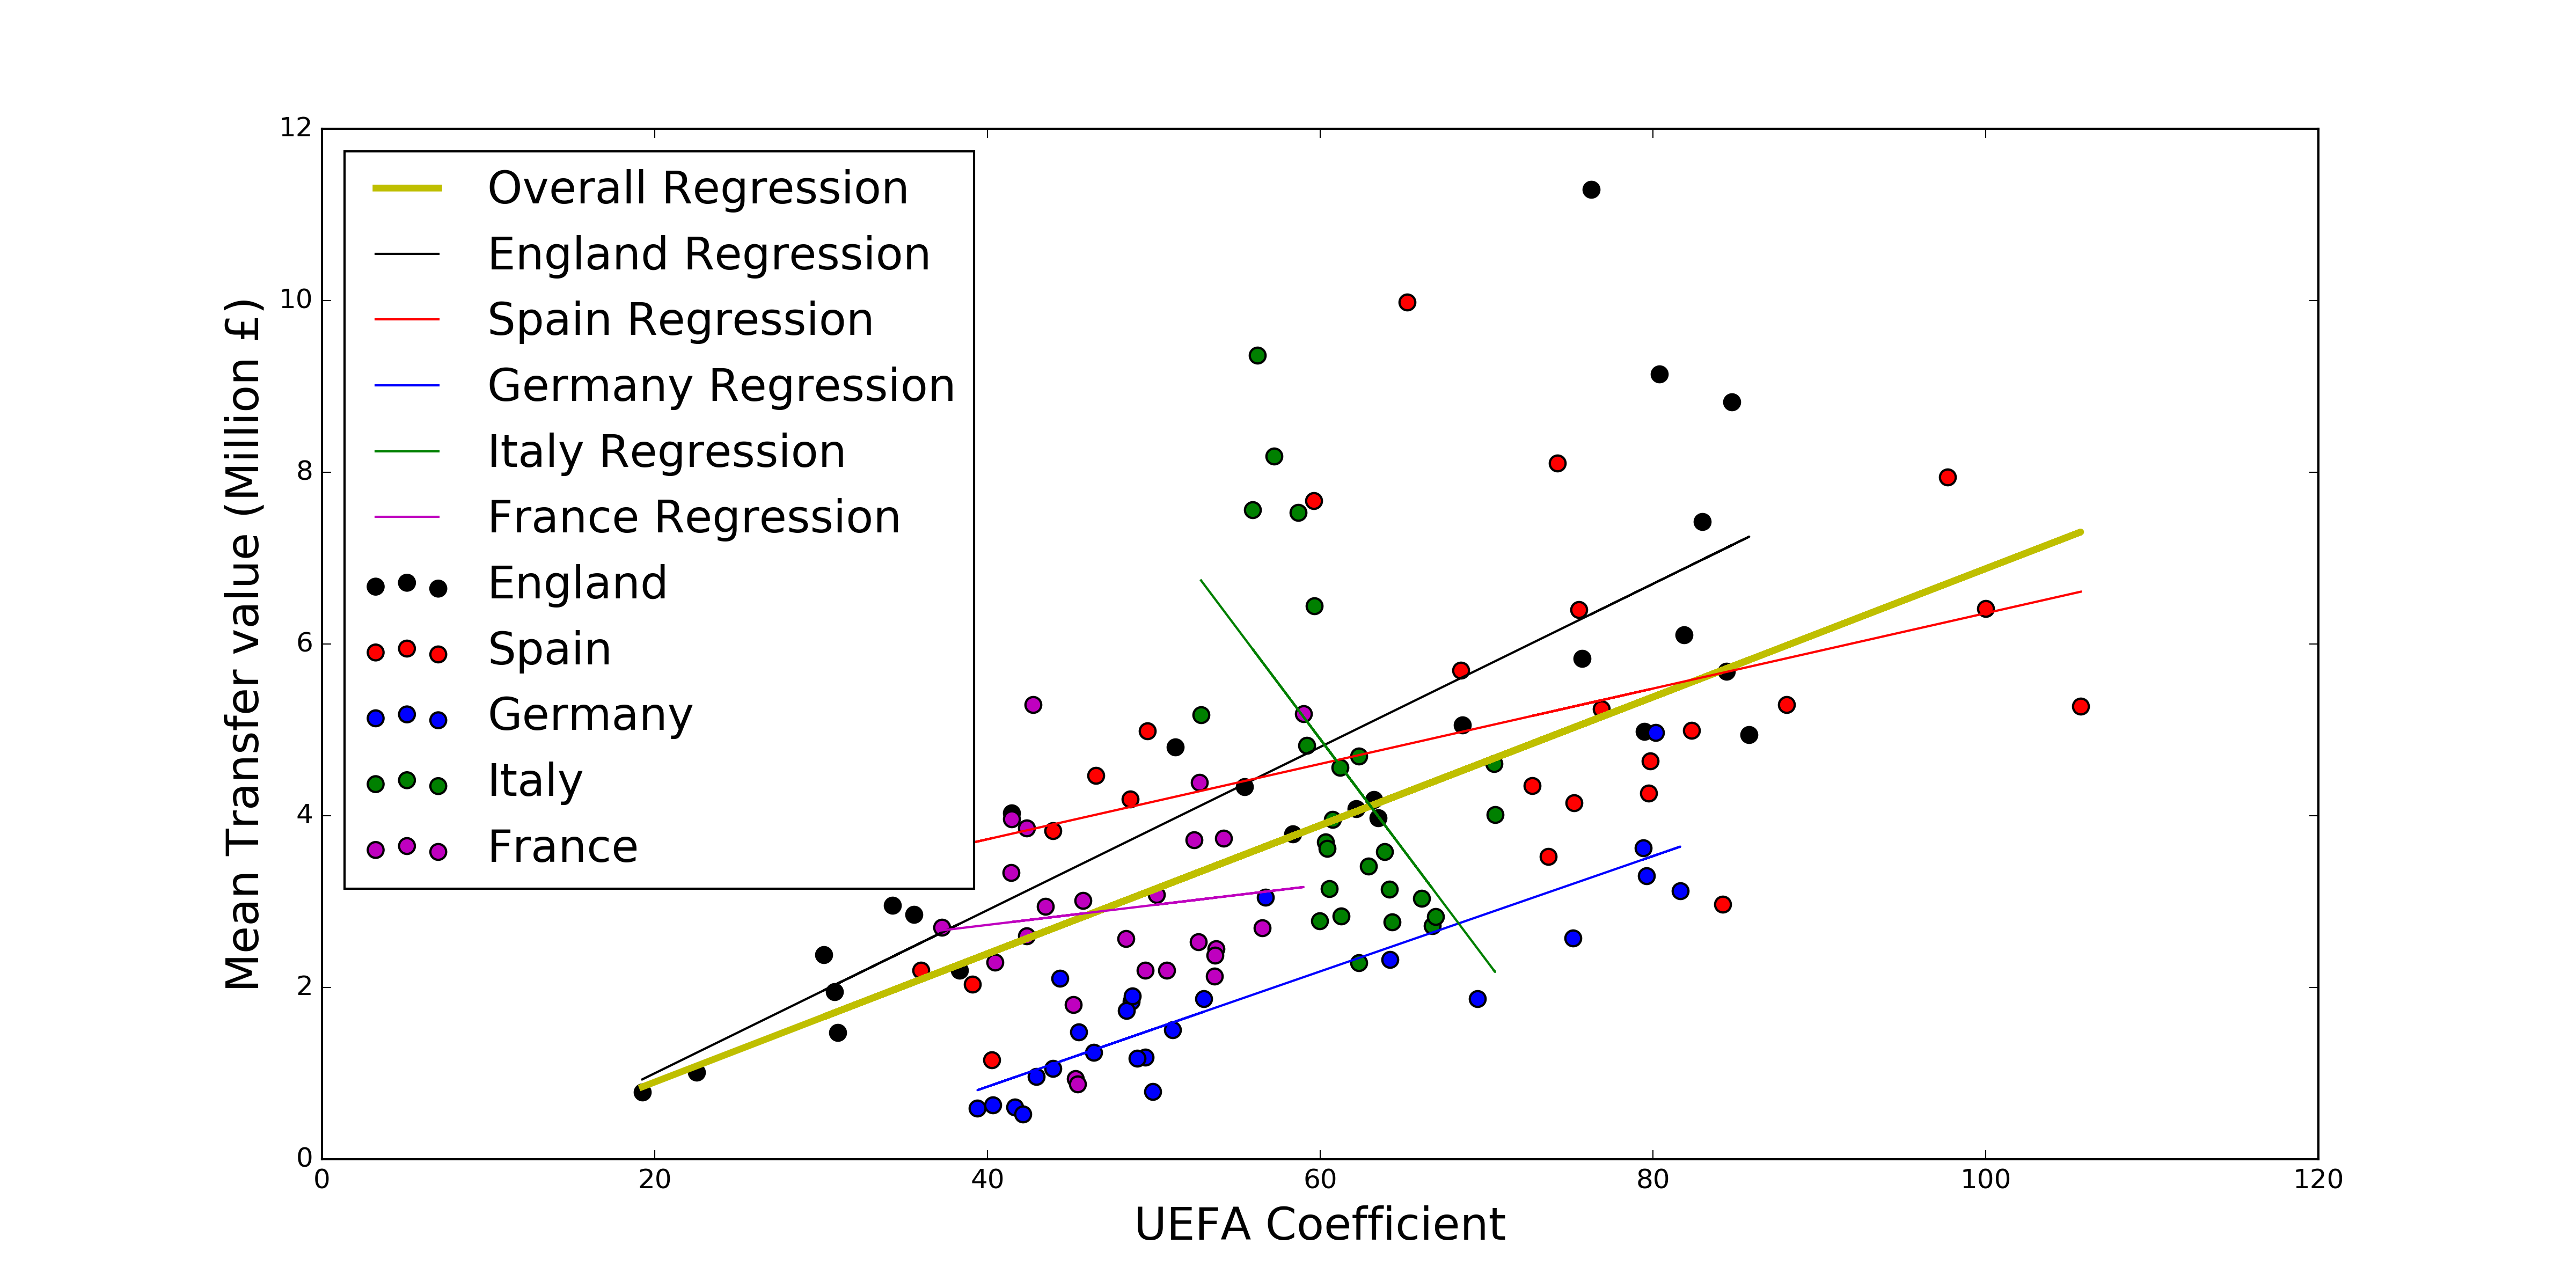
Joe Walshe on Twitter pointed out that the Italian contribution is rather different to the other nations. So at the expense of some clarity, we can look at the individual regressions of each nation:
Clearly Italy is very different. Basically with an increasing mean transfer spend in the Italian league, there is no increase in their UEFA coefficient. If we remove Italy from our regression fit we get the slightly improved value of 0.65 (95% CI: [0.55, 0.95]).


