It’s football tournament time, which means it’s football tournament prediction time.
For the 2018 World Cup I created a prediction model for the tournament (you can read the details here). Overall the model did well (details on the model validation is here) and I was pretty happy with it.
For this tournament, Euro 2020 2021 2020 (it took me a while to realize that this tournament is called Euro 2020) I have built a new model which is much more simple than my World Cup variant.
There are a few reasons for this decision, primarily based around the fact that this particular tournament is not going to be hosted in one country (as it is usually), but instead will be played over 11 countries. Whilst this could be accounted for in the modelling (as many other people have done) I am not sure exactly how this home advantage will pan out – because the change of format is something which we just have no data on. Not to mention that this year, for the first time, there was a higher % of away wins (40) than home wins (38) [obviously this past year almost every game has been played behind closed doors].
So my model for this tournament first requires a rating for each team. This is similar to the World Football Elo ratings (WFER) but with some changes I have made (I am currently writing up the exact details). It then takes every World Cup and European Championship fixture, excludes the home team (since I do not want that impact in my model) and then looks at the “home” team rating and “away” team rating (these are now meaningless terms) and what the result was.
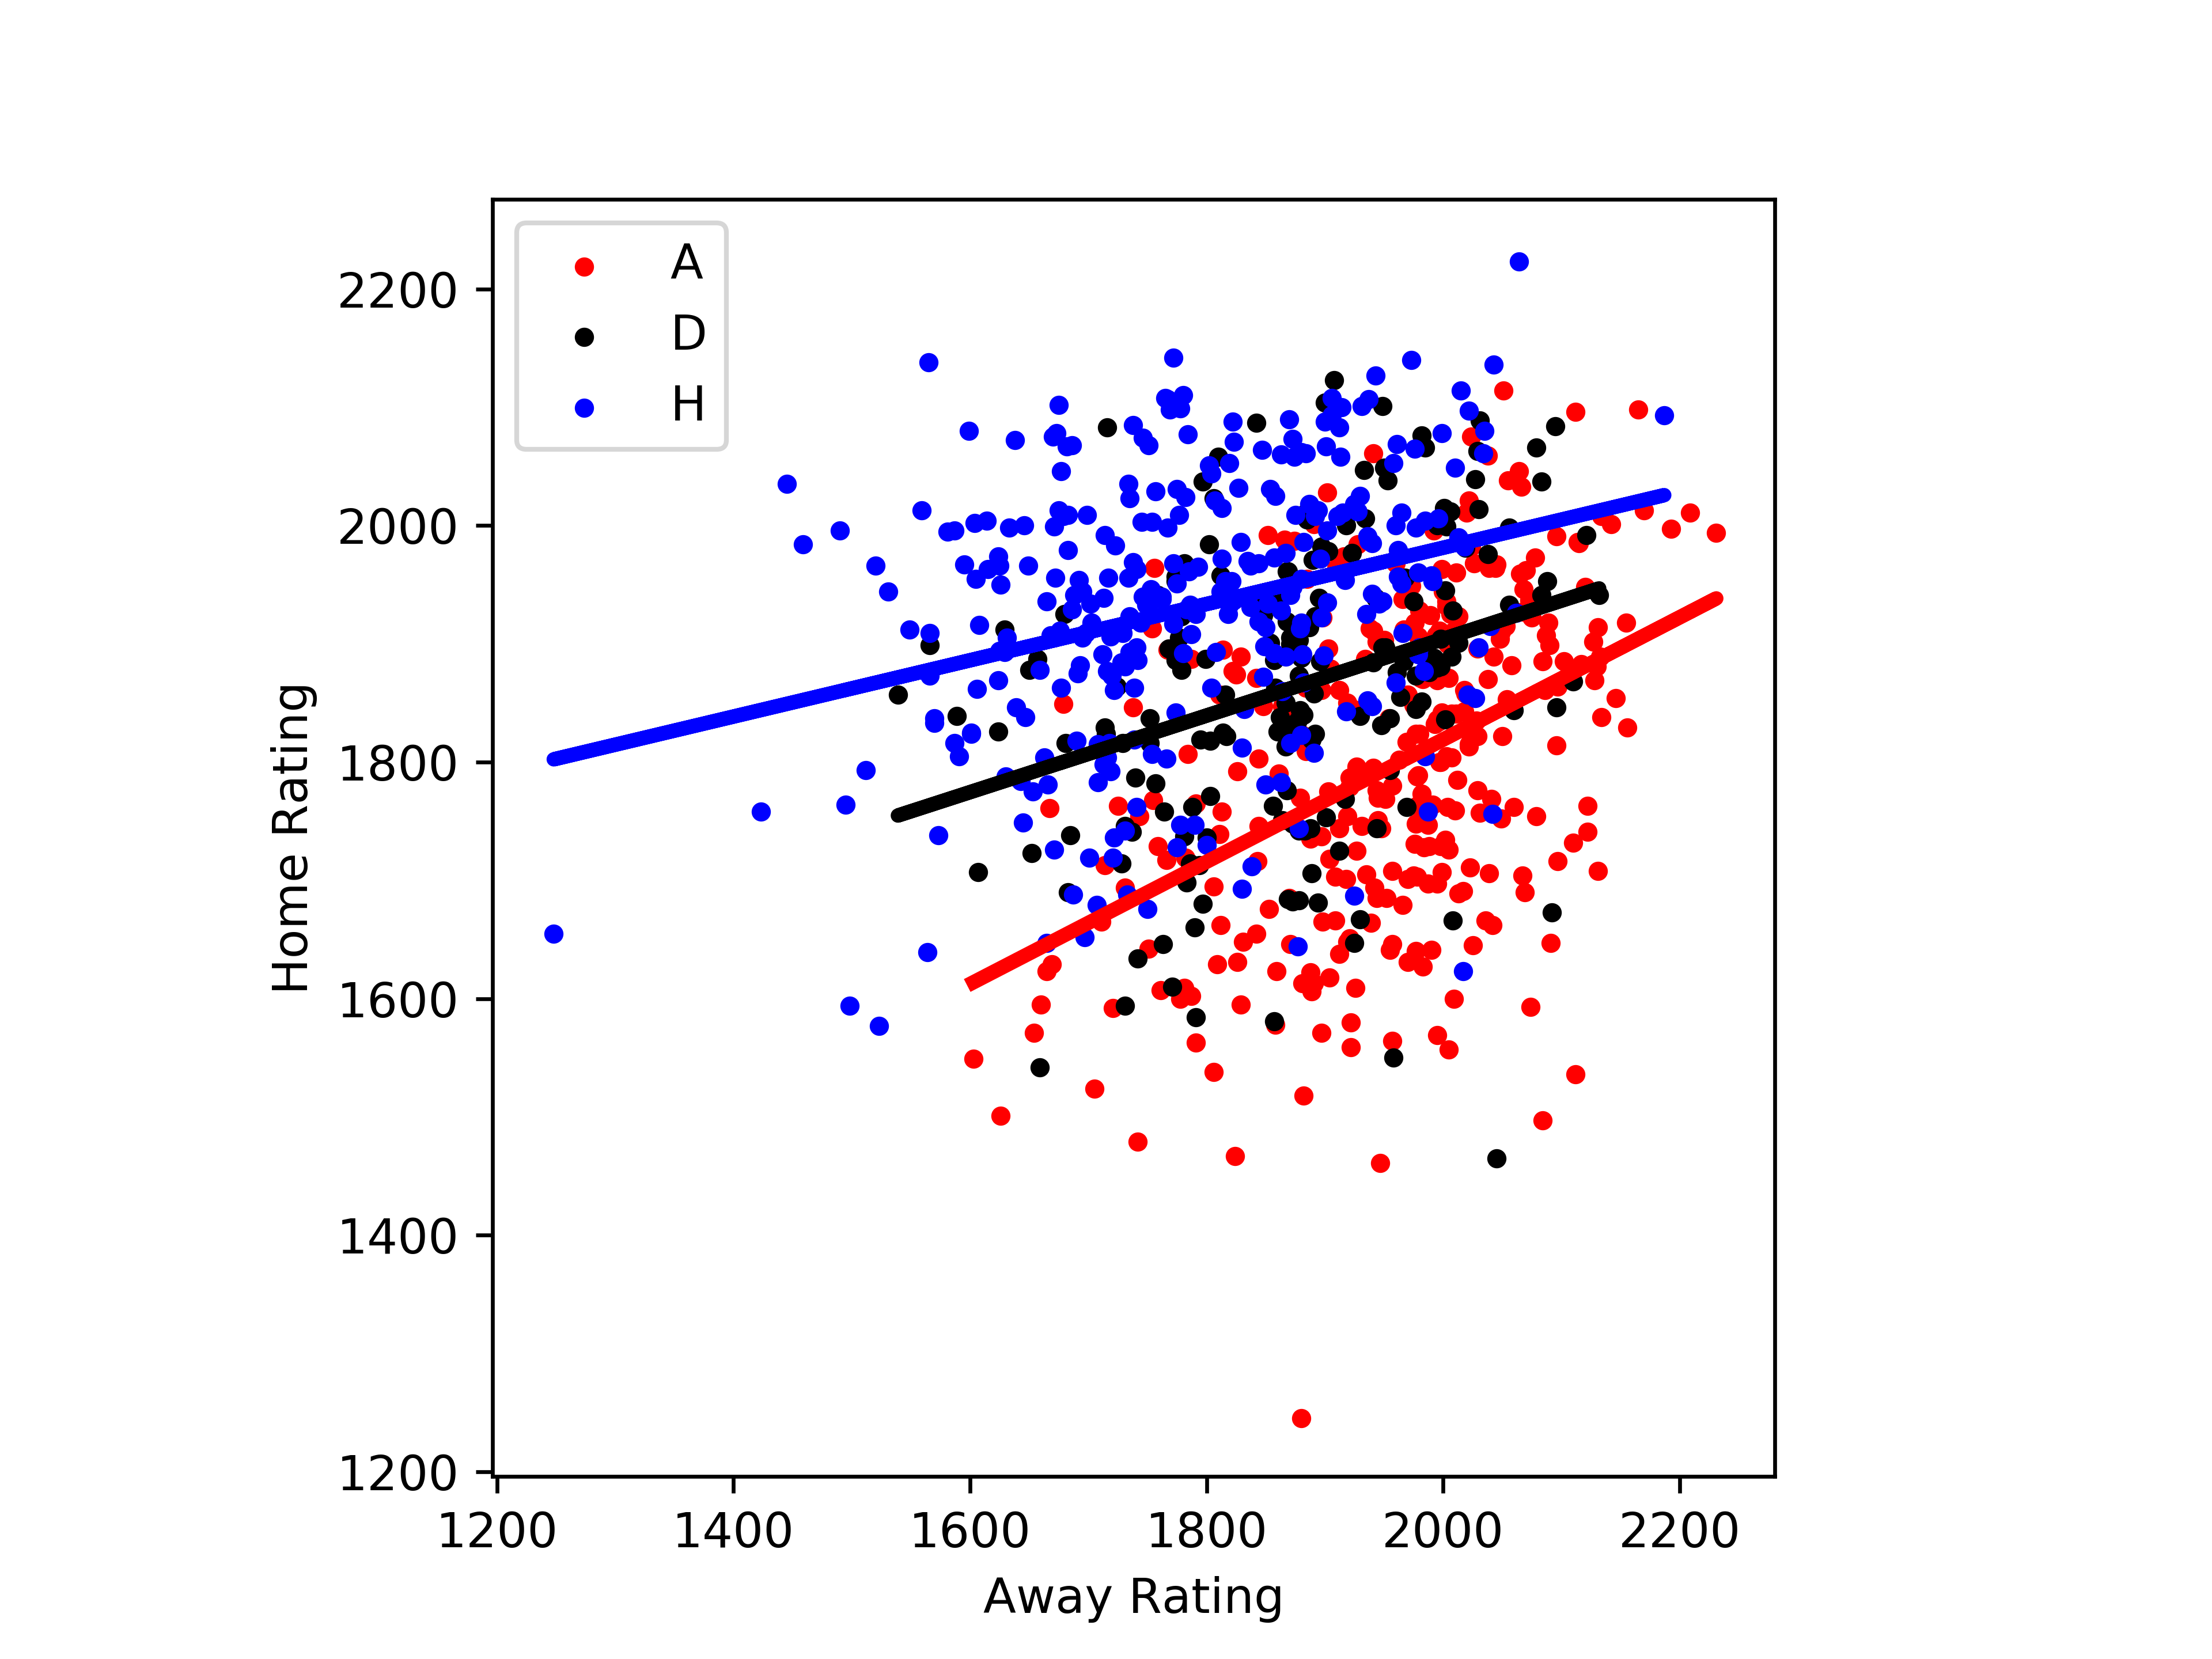
Whilst this plot is obviously quite messy, overall we can see some rough trends. These highlight an immediate problem. Given that I thought I had removed home advantage we should expect that the black line would be exactly on the line y=x. That is, if two teams are equally rated you would expect this is more likely to result in a draw. However you can see from the figure that this is not true. Although the red, ‘away win’ and blue ‘home win’ regressions do confirm what we would expect – e.g. if the home team has a higher rating than the away team then it is more likely to result in a home win. The issues could be explained by either residual home/away impacts in the data, or an issue with my team rating system.
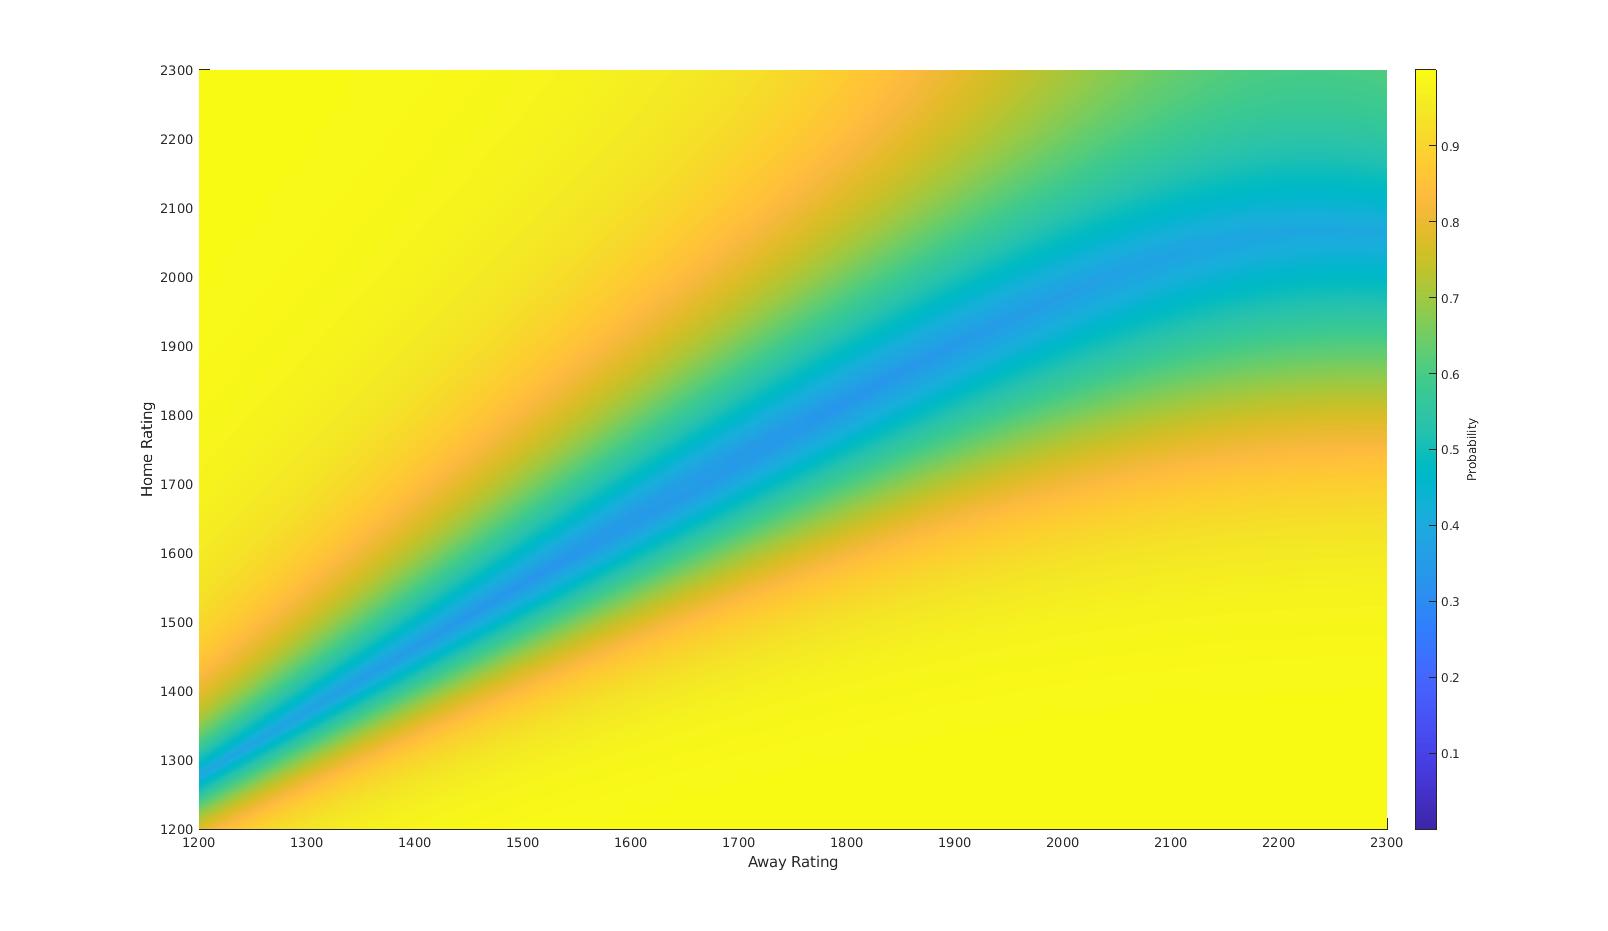
Using this data we could now fit any number of machine learning classification models. For this model we use a naive Bayes classifier, which gives the following probabilities for a home or away win, or a draw:
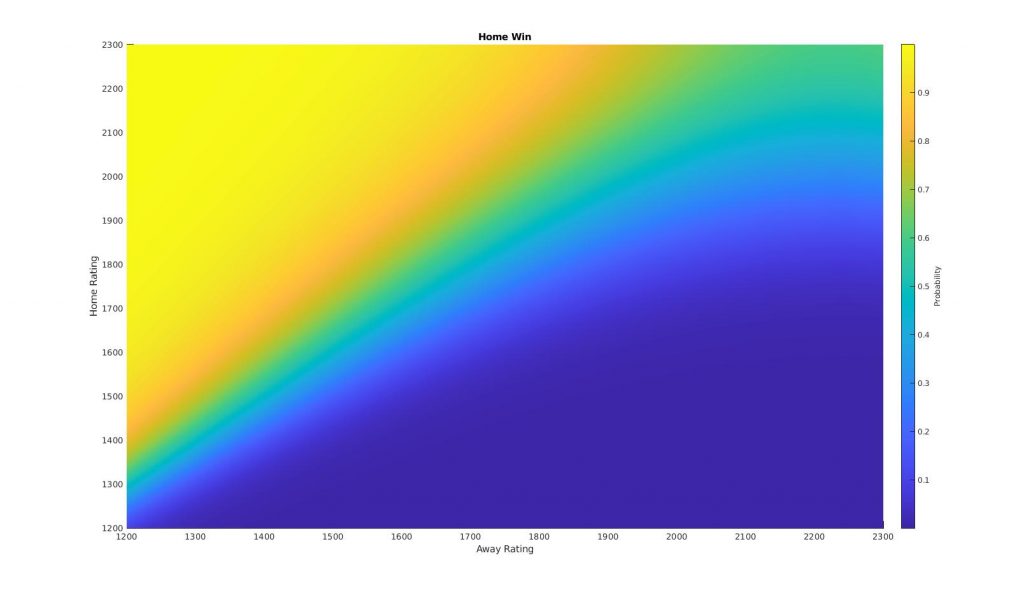
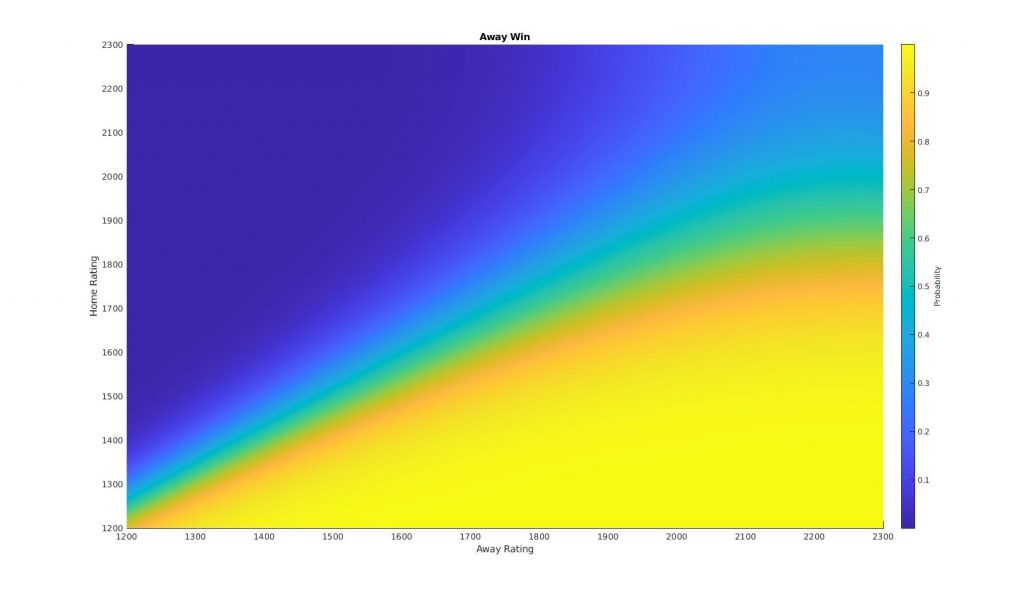
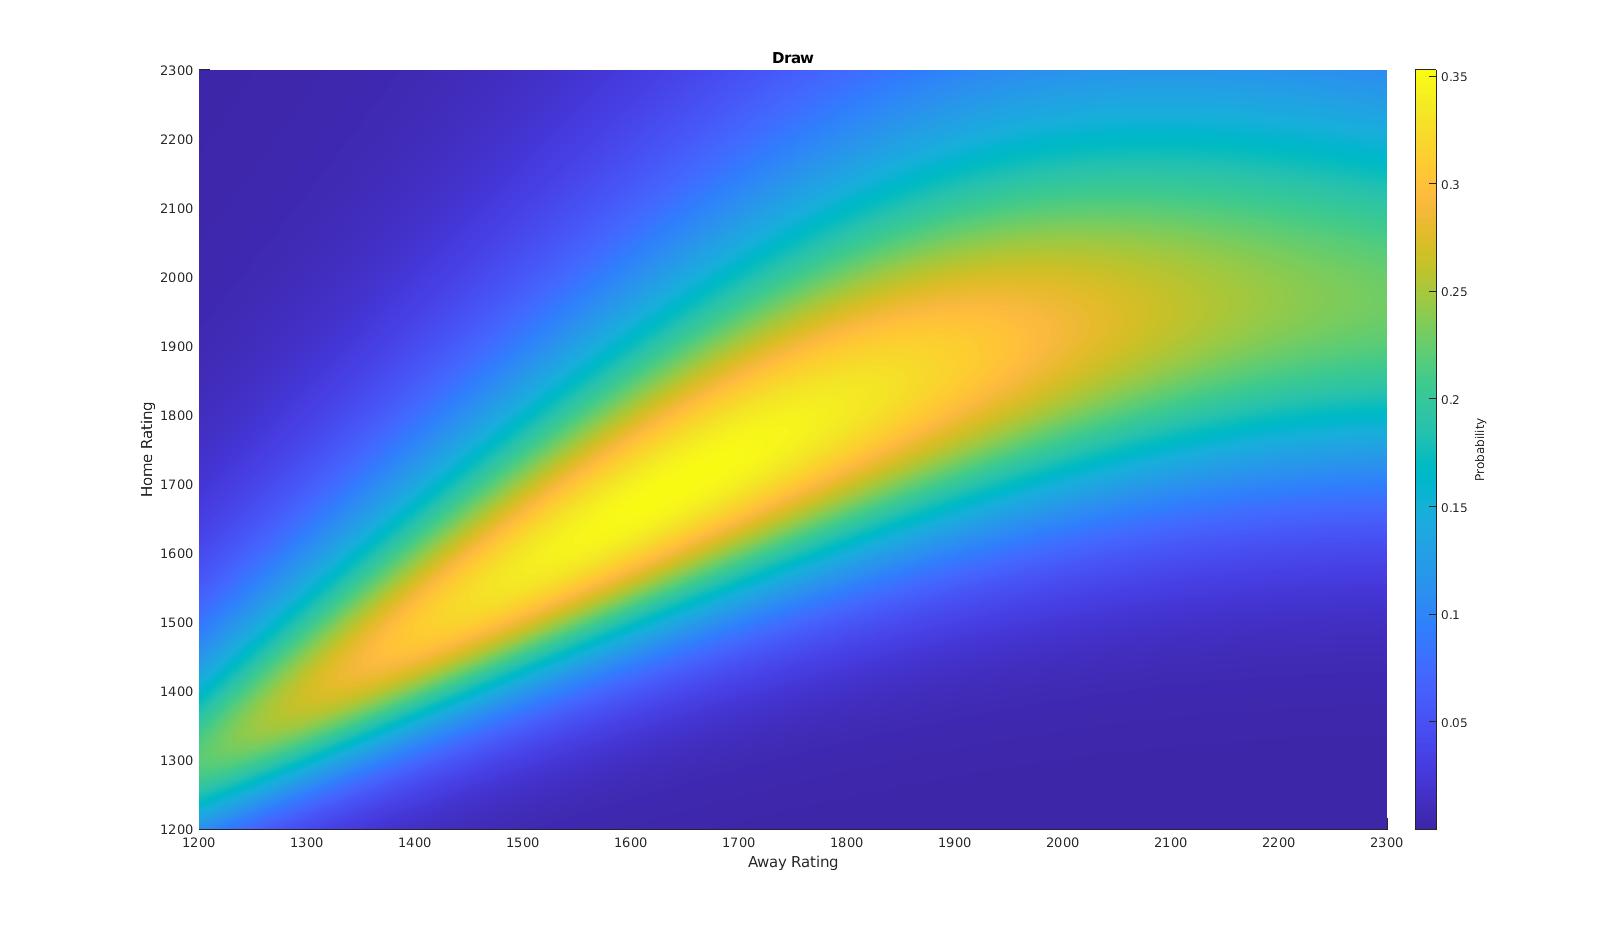
The above plots show how the probability of a given event changes as a function of the two teams rating. Combining all of these plots into one shows the decision ‘surfaces’, as the model transitions from ‘H’ to ‘D’ to ‘A’.
This model can then be used to predict the outcome of the European Championships. Simulating the entire tournament 20,000 times (this was made slightly difficult by the way [some] third-placed teams enter the knockout phase) gives rise to the following probabilities for tournament winners:
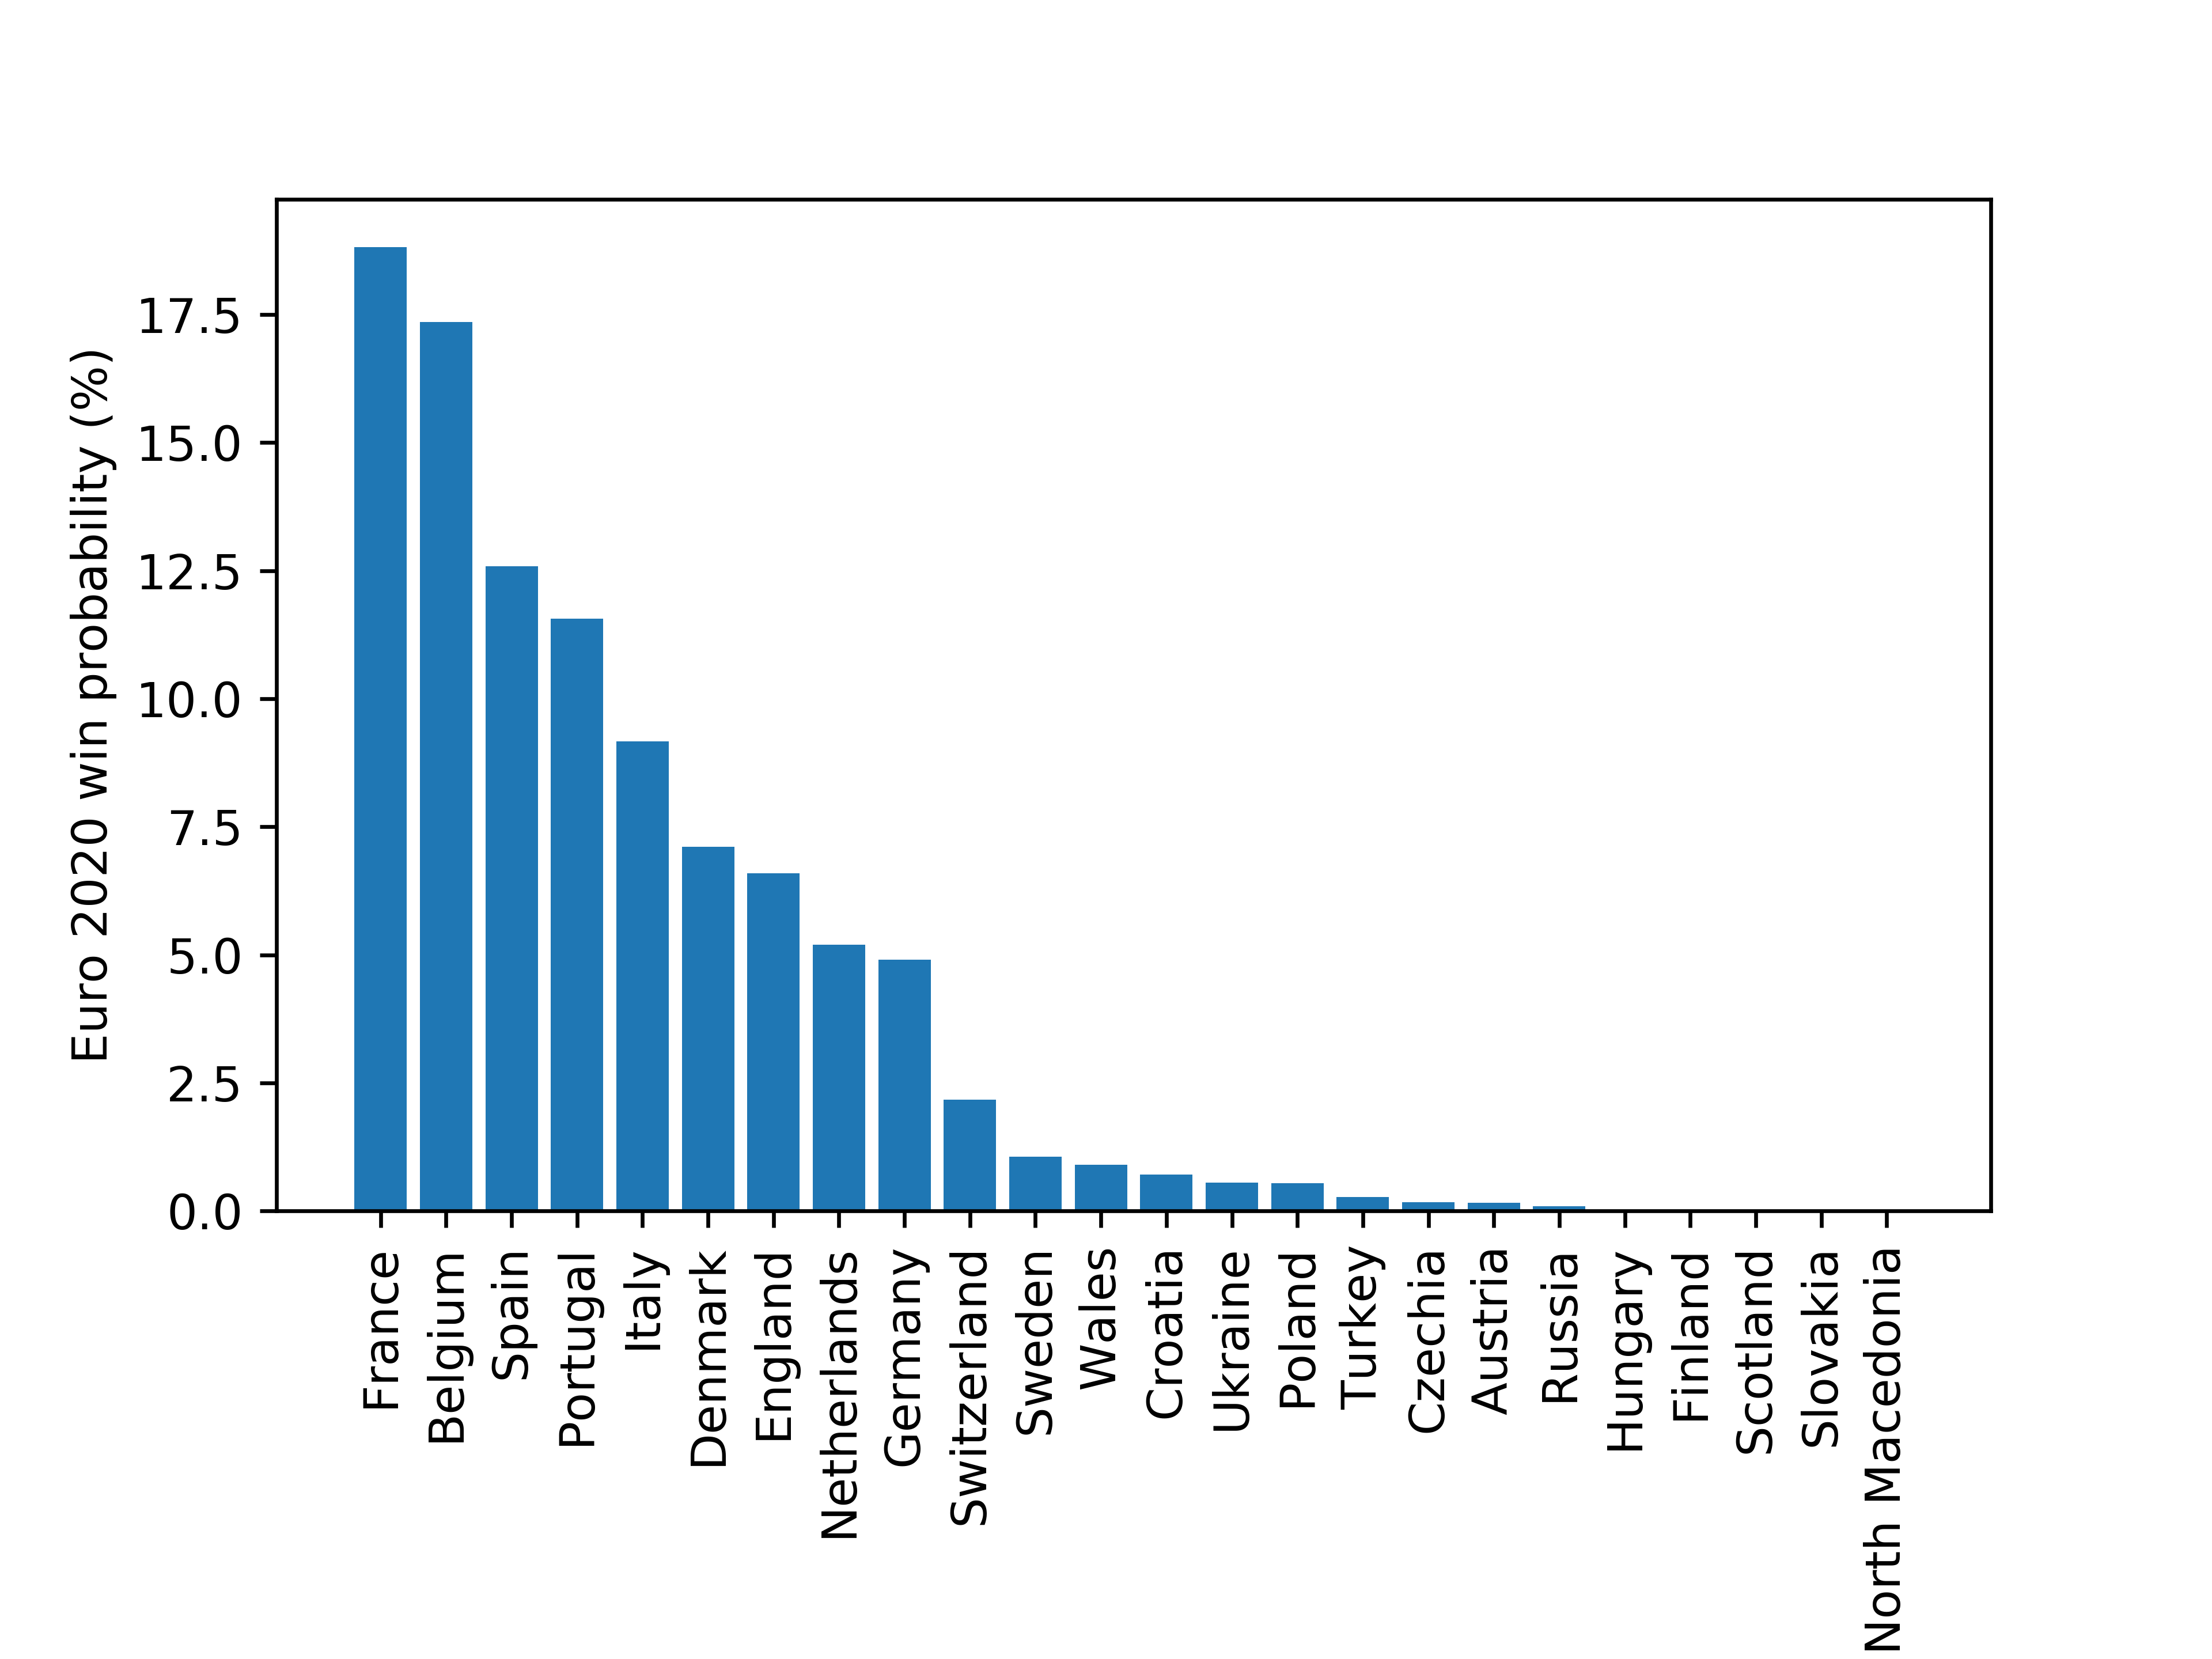
My model predicts that France is most likely to win Euro 2020 closely followed by Belgium. Unfortunately the model only ranks England as 7th most likely with odds of 6.6%.
I’ll update the chart as the tournament progresses. I have entered my model in the Futbolmetrix sophisticated prediction contest, so it will be interesting to see how that turns out:
Announcing the Euro 2020 Sophisticated Prediction Contest. How good is your probabilistic forecast? Can it beat Elo, FIFA, TransferMarkt and other models? Download the spreadsheet here and email it back to me before kickoff of the first match: https://t.co/XkiKsgoq5l
— Futbolmetrix (@Futbolmetrix1) June 3, 2021