Today everyone celebrates being confused why the 14th March (14/3) is celebrated as Pi Day. Instead let us celebrate what it should really be: Feigenbaum Delta Day.
Mitchell Feigenbaum is an award winning mathematical physicist who’s research has made possible the systematic study of chaotic systems. Systems which are very sensitive to their initial conditions.
Consider the double pendulum which is an example of chaotic motion. Minor changes in the initial position of the pendulum give totally different paths that are then mapped out.

(Chaos theory is also often described using “a butterfly flapping its wings in Brazil can cause a hurricane in Texas”. There are issues with this analogy, but the fundamental idea is right, in chaotic systems small changes can have big impacts).
Part of Feigenbaum’s groundbreaking work was in bifurcation theory. In dynamical systems a bifurcation occurs when a small smooth change made to a parameter of that system causes a sudden qualitative change in its behaviour. That means that at a bifurcation the stable properties of the thing you’re interested in (e.g. equilibria, periodic orbits) can change (locally). The easiest way (I find) to think of this is to consider a “period-doubling bifurcation”: doubling, quadrupling, octupling, …

Feigenbaum looked at the ratio of the interval between bifurcations (in the period-doubling example we had above) and noticed something intriguing about it: it tends to a constant.
If a(n) is the location of a (the nth) period-doubling bifurcation and a(n-1) is the location of the one before then:
R1 = a(n) – a(n-1)
is the distance between them. Similarly,
R2 = a(n-1) – a(n-2)
describes the distance between the previous bifurcations.
The ratio we are interested in is then simply R2 divided by R1 (R2/R1).
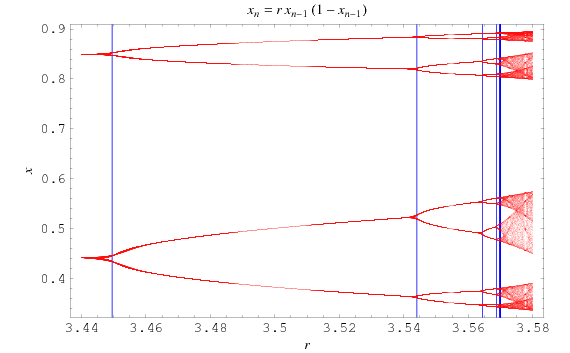
You can calculate this ratio of intervals for any 3 consecutive bifurcations. For example, in the logistic map case (our earlier image) let’s read straight off the diagram three consecutive bifurcations:
a(n-2) = 3.5644073 [furthest left blue line]
a(n-1) = 3.5440903
a(n) = 3.4494897
Calculating the ratio of the interval length gives us a value of 4.6562. If we did the same calculation for the next set of bifurcations we get a value of 4.6683, then 4.6686, then 4.6680, …
This list of ratios goes on forever. If we could (somehow) look right at the end of the list we would see that this ratio (called δ [delta]) is a constant: 4.669201609102990671853203821… (Mathematically speaking we are looking at the limit as n tends to infinity)
But δ doesn’t just appear for these period-doubling bifurcations. The same value arises for all 1D maps with a single quadratic maximum.
Headline: all chaotic systems which meet this description bifurcate at the same rate!
δ in bifurcation theory, is like π in geometry and e in calculus. Fundamental. δ to 3 significant figures is 4.67. Today’s date, 14/3, is 4.67.
Today is Feigenbaum Delta Day.