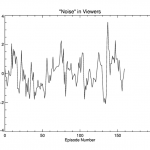
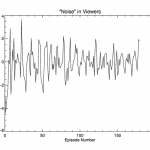
As discussed in my last post we found that ‘the standard deviation of the noise in viewers is about 20% of the range of viewers’ for Grey’s Anatomy. I wanted to see if a similar figure was true for other TV shows.
I would first recommend reading my previous post on this topic as that will explain where we are at. The conclusion was that the standard deviation of the noise in TV viewing figures for Grey’s Anatomy was 19.83% with a standard deviation of 3.06%.
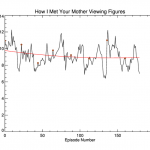
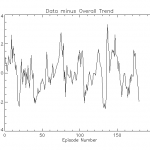
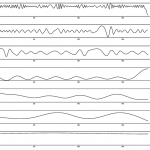
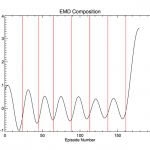
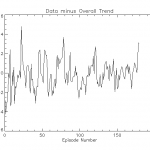
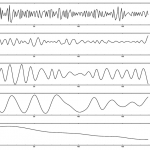
I generated the same plots as in the Grey’s Anatomy post for the shows ‘How I Met Your Mother’ and ‘Desperate Housewives’ which can be seen in the following galleries.
How I Met Your Mother:
Desperate Housewives:
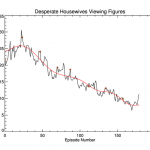
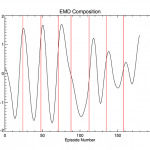
‘Desperate Housewives’ shows a similar pattern to Grey’s Anatomy in terms of the overall viewing figure trend. Increasing initially and then dropping off. ‘How I Met Your Mother’, however, shows a different pattern. Although there are less viewers, the numbers remain fairly constant throughout the show.
From the above analysis we get a standard deviation (as a percentage of the range of viewers) as 17.17% (with a standard deviation of 2.82%) for Desperate Housewives and 21.90% (standard deviation of 2.95%) for How I Met Your Mother.
So the three values we’ve got are 19.83%, 17.17% and 21.90%. Giving an average of 19.63%, well three examples are enough for me! It certainly hints at the fact that the spread of noise in viewing figures is independent of the show, and is actually a fact of TV viewing figures.